It is likely that you have seen various iterations of the below chart produced in the past by financial institutions and advisors (specifically the light and dark grey lines). Usually this chart is used to illustrate the point that investors shouldn’t try to time the market by selling during periods of significant volatility because, if they miss some of the best performing days, their returns will suffer. While we tend to agree with the general conclusion, we think it misses an important point. You shouldn’t compare the result of missing the best days without assessing the other side of the coin - what would happen if one missed the worst days in the market? A crucial aspect of investing is the math of gains and losses. When investments lose ground, they must make up more ground, percentage-wise, just to get back to even. Put simply, a 50% gain does not allow a portfolio to recover from a 50% loss. In fact, a 100% gain is required to recover a 50% loss. If we take this math into consideration, missing the worst days in the market should lead to better results than participating in the best days. That’s exactly what the below chart illustrates:
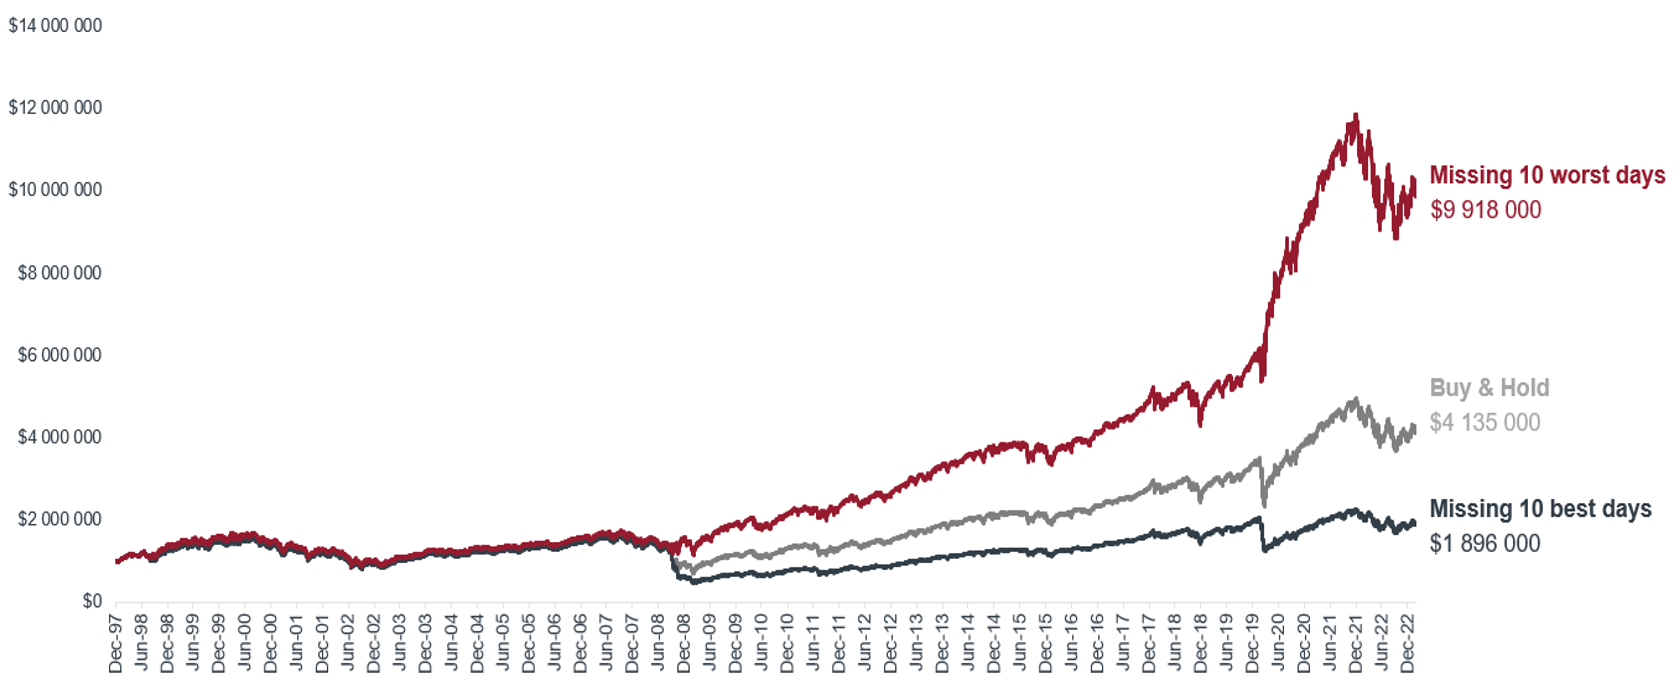
The above chart shows the performance of the S&P 500 Index from 1998-2022 using three hypothetical scenarios:
Buy and Hold: $1 000 000 invested into the S&P 500 in 1998, grows to $4 145 000 in 2022.
Missing the 10 Best Days in the Market: If you invested $1 000 000 into the S&P 500 in 1998, but happened to miss the 10 best performance days, your investment would have grown to $1 896 000 in 2022.
Missing the 10 Worst Days in the Market: If you invested $1 000 000 into the S&P 500 in 1998, but avoided the 10 worst days, twenty years later your investment would have grown to $9 918 000.
As is evident from the chart above, missing the 10 worst days and 10 best days has a substantial impact on returns. The nuance here is that missing the worst days massively boosts a portfolio’s returns, rather than harming them. Our research shows that avoiding some of the worst days in the market has historically led to better returns than staying fully invested.
It is perhaps prudent to mention that the purpose of this article is not aimed at encouraging investors to attempt to time the market, by moving in and out at what they believe to be opportune moments. In fact, countless research has proven that this usually only serves to inflict further damage and impedes the ability to capitalise on the power of compounding. We agree that one of the most important parts of investing is to stay invested. But why weather the storm when you can implement a different approach that minimises the impact of the storm? Our approach at 36ONE is just this - to preserve and grow capital more efficiently than a traditional buy and hold strategy. We do this by adding portfolio protection and deploying a more tactical investing approach within our portfolios. So while we are able to participate and capture majority of the best days in the market, we importantly try to protect against the effects of the worst days for you - we have a long-term and proven track record that demonstrates this.
Circling back to the title of this article, JOMO - which is the acronym for the ‘joy of missing out’ - is the outcome we are trying to achieve for investors: our strategy has resulted in delivering returns that capture the majority of the market’s best days, while ‘missing out’ - by significantly reducing exposure through the use of portfolio protection and tactical asset allocation - during the market’s worst performing days. The result is that our hedge funds have significantly outperformed the market over time and due to their valuable downside risk-mitigating benefits, they have achieved this outperformance with substantially less volatility and drawdowns. In the case of our long only funds, they have historically provided lower downside capture than our peers, resulting in top quartile performance.